Here at Zinkerz, we closely monitor trends in the SAT to bring our students the most up-to-date test-taking strategies to utilize their study time best. When answering questions of the Problem Solving and Data Analysis sort, it’s crucial to understand topics like probability, data organization, and statistics. Let’s review some specific topics popping up on the SAT recently and tackle the best way to solve them!
Standard Deviation
Standard deviation is a statistical measure used to describe the data’s average spread, or variability. That is, how far the data points are from the mean.
Larger standard deviation → data spread far from the mean.
Smaller standard deviation → data grouped closely around the mean.
Standard deviation equal to zero → data points are all equal to the mean.
The SAT does not require calculating a standard deviation; instead, it asks you to draw some conclusion by comparing data sets and visually assessing the standard deviation. Let’s look at an example:
Problem 1:
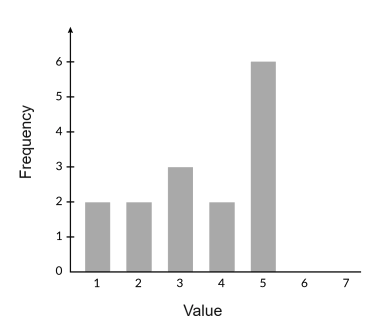
While we don’t need to calculate the exact mean for this question, it’s helpful to estimate in order to picture how spread out the data will be before and after the addition of the extra point. We can see that the mean will be around 3, based on the fact that it is roughly in the middle of the data set. What happens after we include the extra data point with a value of 6? Let’s take a look:

We can see that including the last data point will cause the data set to be further spread out from the mean, thus increasing the standard deviation. Therefore, A is the correct answer.
Box and Whisker Plots
To answer questions involving box and whisker plots, you must be able to read the plot and work with the data it displays. Review below:

For the SAT, ensure you understand how to read the median, the minimum, and maximum values (the values at each of the tick marks on either end of the box and whisker plot) and how to calculate the different types of ranges. Let’s practice!
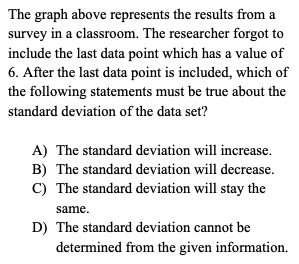
Problem 2:
The ranges for each of these data sets can be found by subtracting the minimum value from the maximum value. Observe:

Therefore, D is the correct answer. Be sure to line up the maximum and minimum values with the correct number on the number line. Again, knowing how to read and work with the data represented by the box and whisker plot is essential to answering these types of questions correctly!
Sampling
These types of questions will ask you to analyze the data collection methods of a hypothetical study or survey. You may be asked to decide what, if any, conclusions can be made based on how the data was collected. You may also be asked how valid the results are and if changes should be made to how the survey is conducted. Let’s look at an example:
Problem 3:
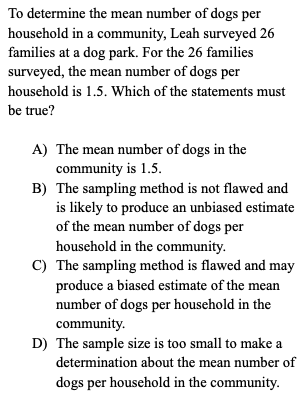
For this question, context matters! Leah is trying to determine the mean (or average) number of dogs per household but collected her data by only speaking to people at a dog park. The assumption is that most people at a dog park would have at least one dog. Her data collection methods do not consider other community members that do not go to the dog park because they don’t have a dog. Because of this, her data may be flawed, and the mean may not represent the whole community. Therefore, the correct answer is C.
Margin of Error
The margin of error is a statistical measurement (usually a percent amount) that describes the difference between the actual and projected results of a survey that uses random sampling. The most reliable surveys do their best to collect data in a way that minimizes the margin of error. The larger the margin of error, the less confident we should be in the results.
We can use the margin of error to calculate the range of plausible results. This is done by adding and subtracting the margin of error from the given result. These types of questions are usually elementary, so let’s break down an example:
Problem 4:
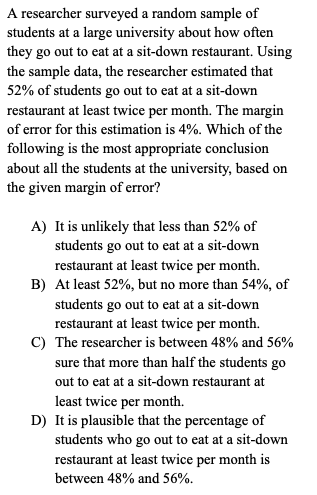
First, let’s use the margin of error to calculate the range of plausible values resulting from this random sample:

We can then eliminate choices A and B because it is clear that those choices do not use the margin of error correctly. Our answer should involve 48% and 56%. Choice C describes a measurement called the confidence interval, which differs from the margin of error. So, therefore, we cannot draw an appropriate conclusion about the confidence interval or how “sure” the researcher is.
Choice D is correct because it describes the range of values that are plausible based on the given margin of error and our calculations.
Scatterplots
Scatterplots show up in a variety of ways on the SAT. You may be asked to predict a value, choose a line of best fit, or analyze the linear relationship in some way. Let’s check out an example:
Problem 5:
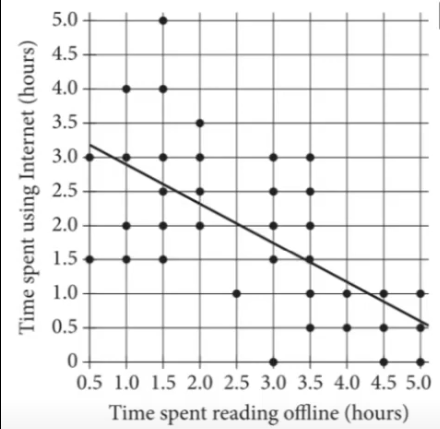
Don’t let this question’s long preamble distract or confuse you. We’re looking for the data points that lie far above the line of best fit. We want to count the number of data points that are at least 2 units above the line of best fit, since the y-axis is measured in half-hour increments. These will represent the students for which the line of best fit underestimates their time spent on the internet by more than one hour.

We can see that this is the case for the seven students circled above. Therefore, the correct answer is D.
The SAT Math section can feel daunting when trying to master every possible topic. Get comfortable with the foundational topics in algebra and geometry, and utilize strong study and test-taking strategies. The Math section of the SAT doesn’t have to be scary! You got this!